The Produce OS Dashboard:
Where the Day Begins
For many produce professionals, the workday begins long before the first phone call or customer conversation comes in: decisions need to be made, priorities need to be established and teams need a clear understanding of what is happening across the business. Yet obtaining the whole picture often requires navigating multiple systems, reports, spreadsheets, emails and communication channels before meaningful work can even begin.
The Produce OS Dashboard was designed to simplify that experience. Rather than functioning as another reporting tool, it serves as the operational starting point for the day: a workspace where business activity, market intelligence, operational priorities and next actions come together in a single view.
Starting the Day with Context
One of the biggest challenges in produce is not the lack of information: it is understanding what deserves attention first. The Produce OS Dashboard helps users quickly establish context around what is happening across the business.
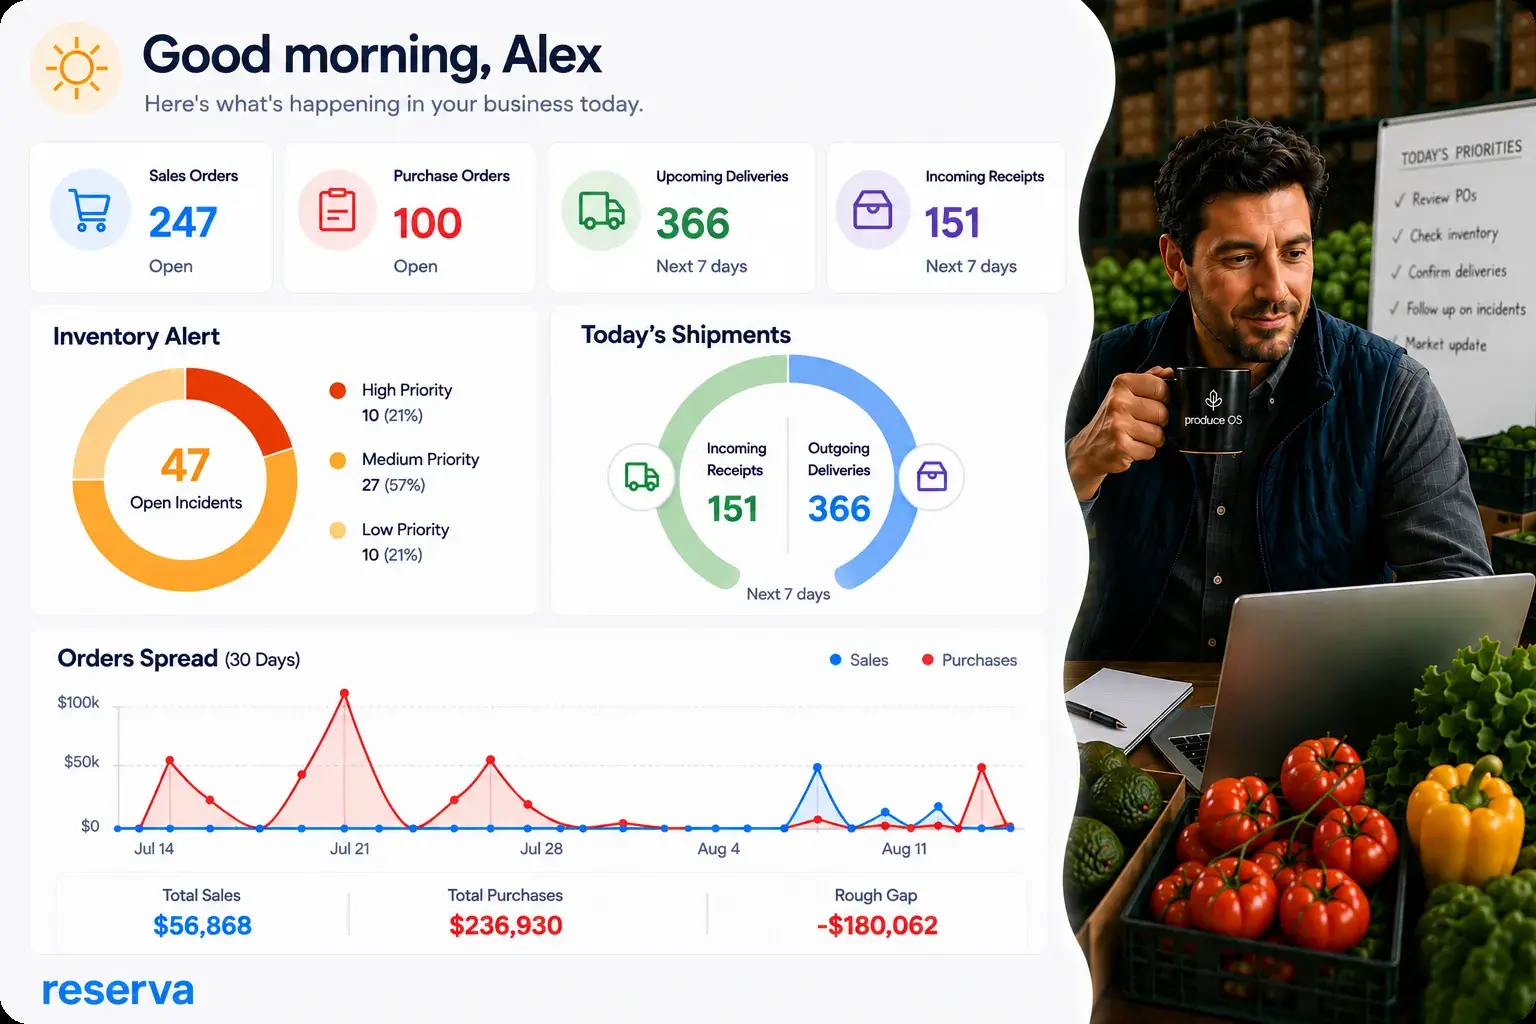
Open sales orders, purchasing activity, pending deliveries, incoming receipts, inventory information, operational metrics and business performance indicators are presented together, allowing teams to assess the current state of operations without spending valuable time gathering information from multiple sources.
The goal is simple: help produce professionals move more quickly from awareness to action.
A Typical Morning Inside Produce OS
Imagine arriving at the office on a Tuesday morning. Before opening multiple systems, reviewing emails or requesting updates from different departments, the Produce OS Dashboard immediately provides a snapshot of the business.
A quick glance reveals open sales orders, pending purchase orders, upcoming deliveries and incoming receipts scheduled for the day. While reviewing operations, an inventory incident appears that may require attention.
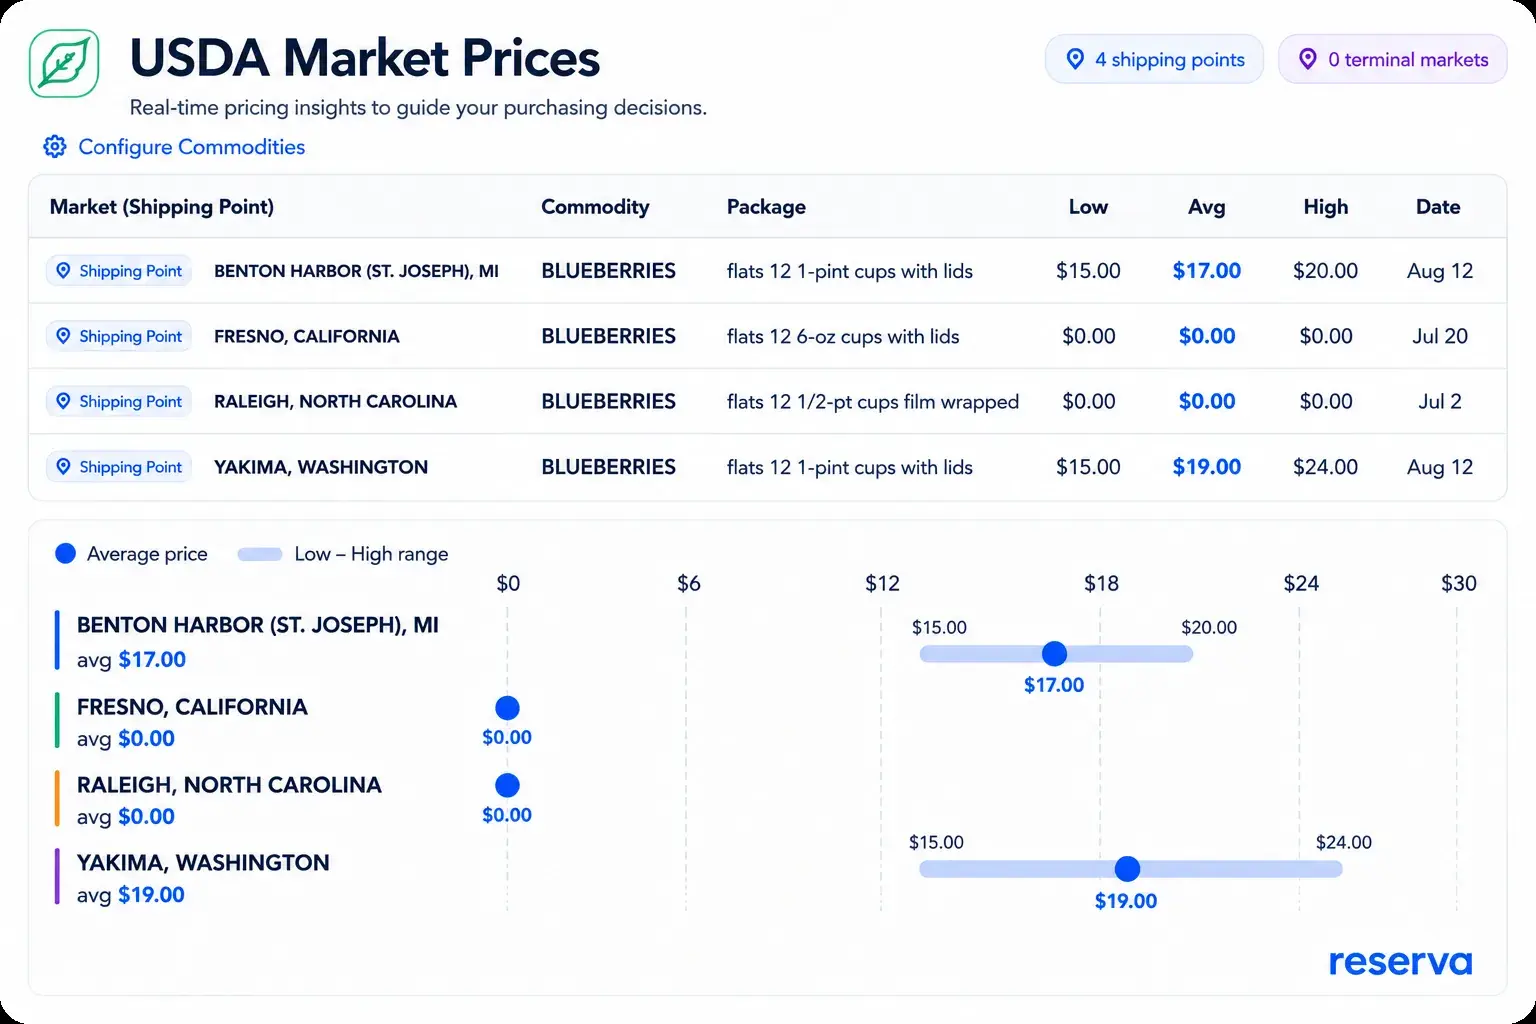
At the same time, USDA market pricing shows movement in a commodity that impacts purchasing decisions. With both operational activity and market context available in the same workspace, the user can quickly evaluate priorities and determine the next steps.
From Dashboard to Action in Minutes
Within minutes of opening Produce OS, teams move from gathering information to taking action. Here is what becomes possible directly from the dashboard:
Create Purchase Orders
A new purchase order can be created directly from the dashboard based on market signals and inventory needs.
Review Upcoming Shipments
Upcoming deliveries and shipments can be reviewed without navigating away from the dashboard workspace.
Investigate Inventory Activity
Inventory incidents and stock movements can be investigated right from the dashboard, reducing response time.
That is the purpose of the Produce OS Dashboard: helping teams start the day informed, aligned, and ready to move business forward.
From Market Intelligence to Action
In the produce sector, purchasing activity, sales opportunities, pricing strategies and inventory planning are constantly influenced by changing market conditions. That is why Produce OS integrates USDA market pricing directly into the dashboard experience.
Users can configure the commodities most relevant to their business, monitor specific markets, and compare pricing activity without leaving their daily workspace.
But information alone does not move a business forward. The real value comes from the ability to act on the information given.
As users review market conditions, operational activity and business performance, they can immediately move into the next step: new sales orders and purchase orders can be created, upcoming shipments can be reviewed, inventory activity can be investigated and operational workflows can be accessed directly from the dashboard.
Rather than forcing teams to separate analysis from execution, Produce OS brings both together in the same environment. The result is a more natural workflow where information leads to decisions and decisions quickly turn into action.
More Than a Dashboard
The Produce OS Dashboard was never intended to be a collection of charts and metrics: charts and metrics mean nothing without context and accurate positioning.
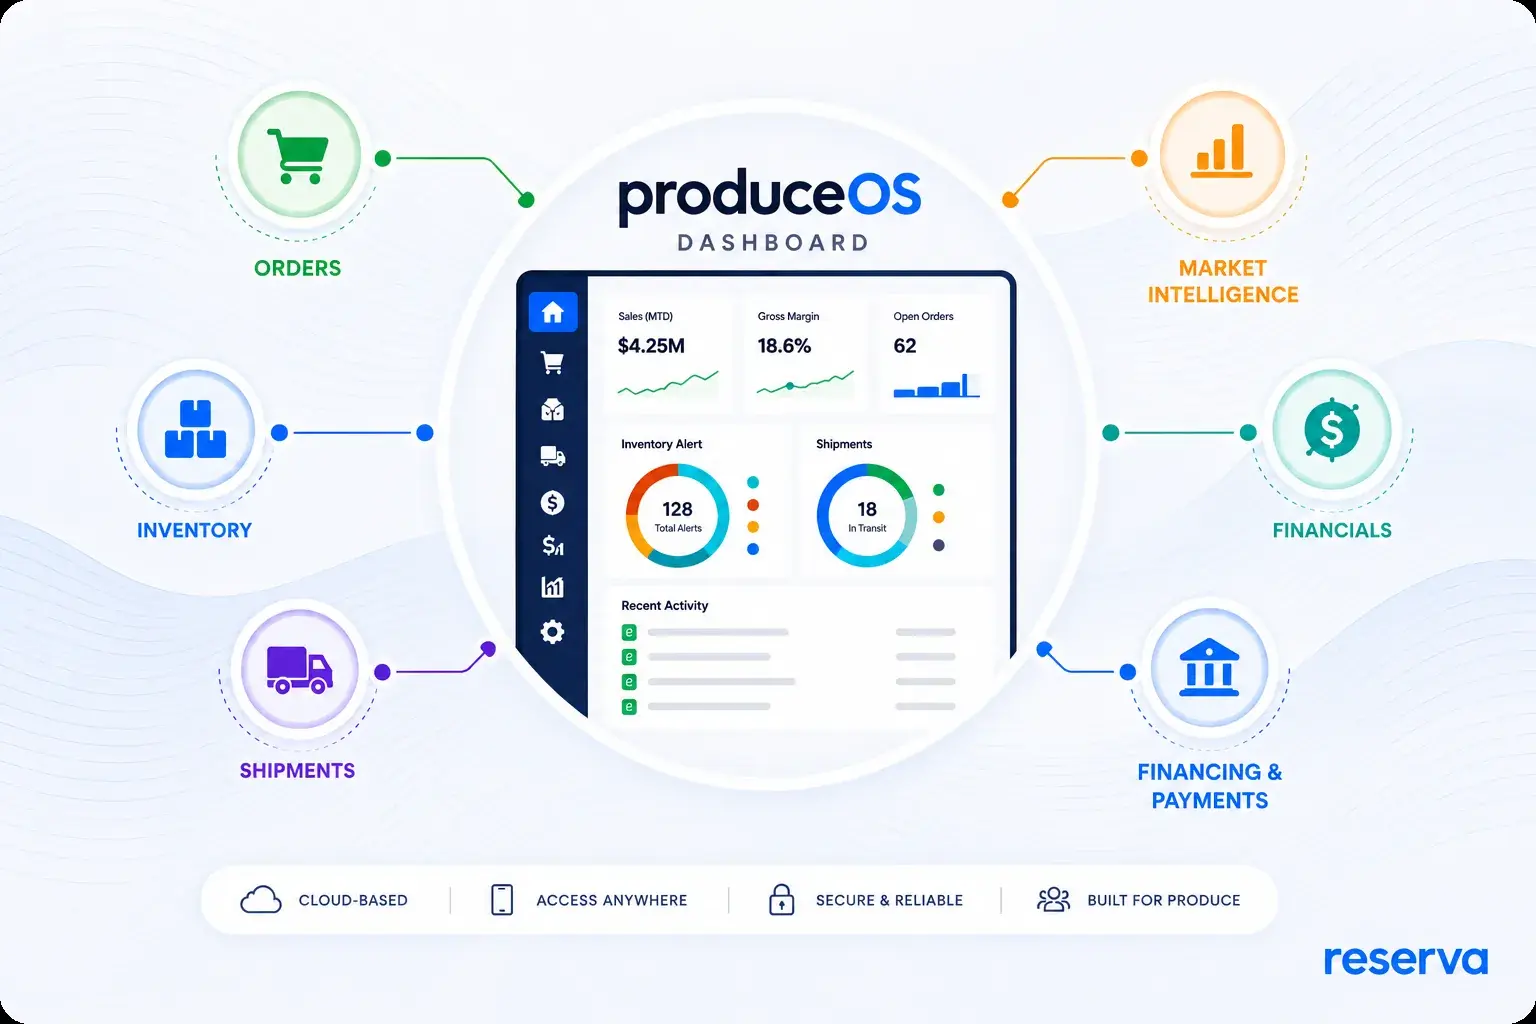
It was designed to become the place where produce teams start their day, understand the state of the business, and take action accordingly. A workspace where operational activity, market intelligence, orders, inventory, shipments and business priorities come together.
Because in produce, knowing what is happening is important, but knowing what to do next is even more valuable in your day-to-day business movements.
Ready to See Produce OS in Action?
Discover how the Produce OS Dashboard helps teams stay informed, prioritize work and move from information to action faster every day.
Get Early Access!